Skip to content
Make MyMISData · Reports · Decisions

Case Studies

How We Read a Business.

Analytical case studies by our founders, across retail, pharmaceuticals, food delivery and logistics. Built on public datasets, not client engagements — no client has commissioned us yet, and we would rather say so than let a company name imply otherwise.

Case studyOct 2024 — Nov 2024

Return-Rate Economics for a ₹7.2 Crore Apparel Business

Read revenue, returns and fulfilment against each other to show that three separate-looking problems shared one cause: a ₹596 basket too thin to carry a clothing return rate.

An e-commerce company was struggling on three fronts at once — financial performance, customer satisfaction and logistics efficiency. The analysis identified top-selling products and peak sales periods, separated B2B from B2C buying behaviour, and measured average shipping times and fulfilment efficiency. Returns turned out to concentrate in clothing and to be driven by fit, which makes them a product-page problem: the recommendations led with detailed sizing guides and size-recommendation tools, then moved to balancing revenue across the year with off-peak campaigns, and to lifting the B2C basket through bundles and loyalty.

Revenue analysed
₹7,17,72,313
Average order value
₹596
Top-selling category
Set
  • Excel
  • Power BI
  • Python
  • PowerPoint

Public e-commerce dataset. Not a client engagement.
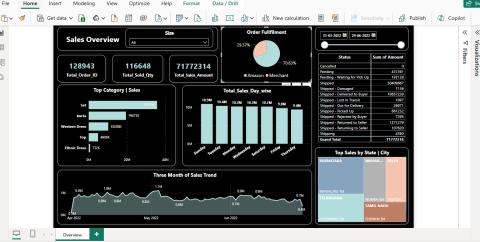
Power BI Sales Overview dashboard showing total orders, units sold and revenue, with top category sales, day-wise sales, a three-month trend line and a state-level sales breakdown.
Case studyNov 2024

Precision Medicine: Which Patient Gets Which Drug

Clinical trial and genomic data read three ways — which patients respond, which patients react badly, and which treatment plans hold up on progression-free survival.

A case study on Pfizer’s personalised medicine programme, built to be acted on by non-technical stakeholders rather than admired by analysts. It examined which patient demographics and genetic factors affect drug efficacy, whether side effects follow patterns across demographics and genetic profiles, and which treatment plans perform best by progression-free survival. Read together, those answers support safer prescribing for specific patient groups, more inclusive trial design across ethnicities, genders and age groups, and sharper allocation of trial budget towards the drugs with the strongest outlook.

  • Excel
  • Power BI
  • Healthcare

Public clinical-trial dataset, analysed independently. No relationship with Pfizer, and not a client engagement.

Case studyOct 2024

Delivery Reliability for a Food Delivery Platform

Located the delays and cancellations behind a falling satisfaction score, city by city and cuisine by cuisine, so operations had somewhere specific to start.

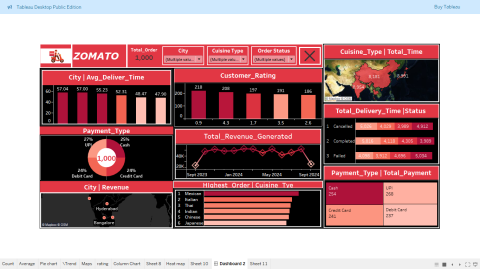
Zomato, one of India’s leading food delivery platforms, was facing declining customer satisfaction and engagement, rising order cancellations, inconsistent delivery times and regional disparities in sales. The analysis went through customer orders, delivery times and restaurant ratings to surface average delivery times across cities and by cuisine, revenue and regional performance trends, and customer behaviour including preferred payment methods and rating distribution — the inputs an operations team needs to streamline delivery and a marketing team needs to target retention.

  • Tableau
  • Excel
  • Data Visualisation

Public food-delivery dataset, analysed independently. No relationship with Zomato, and not a client engagement.

Tableau dashboard for Zomato showing average delivery time and revenue by city, customer ratings, payment type split, total revenue generated over time and delivery time by order status.
Case studyAug 2024 — Sep 2024

ShipFast Logistics Superstore Dashboard

Sales, profit and shipment mode tracked on one screen, so shipping performance and margin are read together instead of in two separate reports.

An interactive Looker Studio dashboard covering order dates, sales, profits and shipment modes for a logistics superstore. It puts the critical performance metrics behind shipping and supply chain management in one place, giving the team the visibility to streamline logistics processes and improve day-to-day decision-making rather than waiting on a periodic export.

  • Looker Studio
  • Excel
  • Dashboard
  • Logistics

Public superstore dataset. Not a client engagement.

Let's make your business data work harder.

Send a sample, or just describe the report you need. We will tell you what it would take — and if we are not the right people for it, we will say that instead.